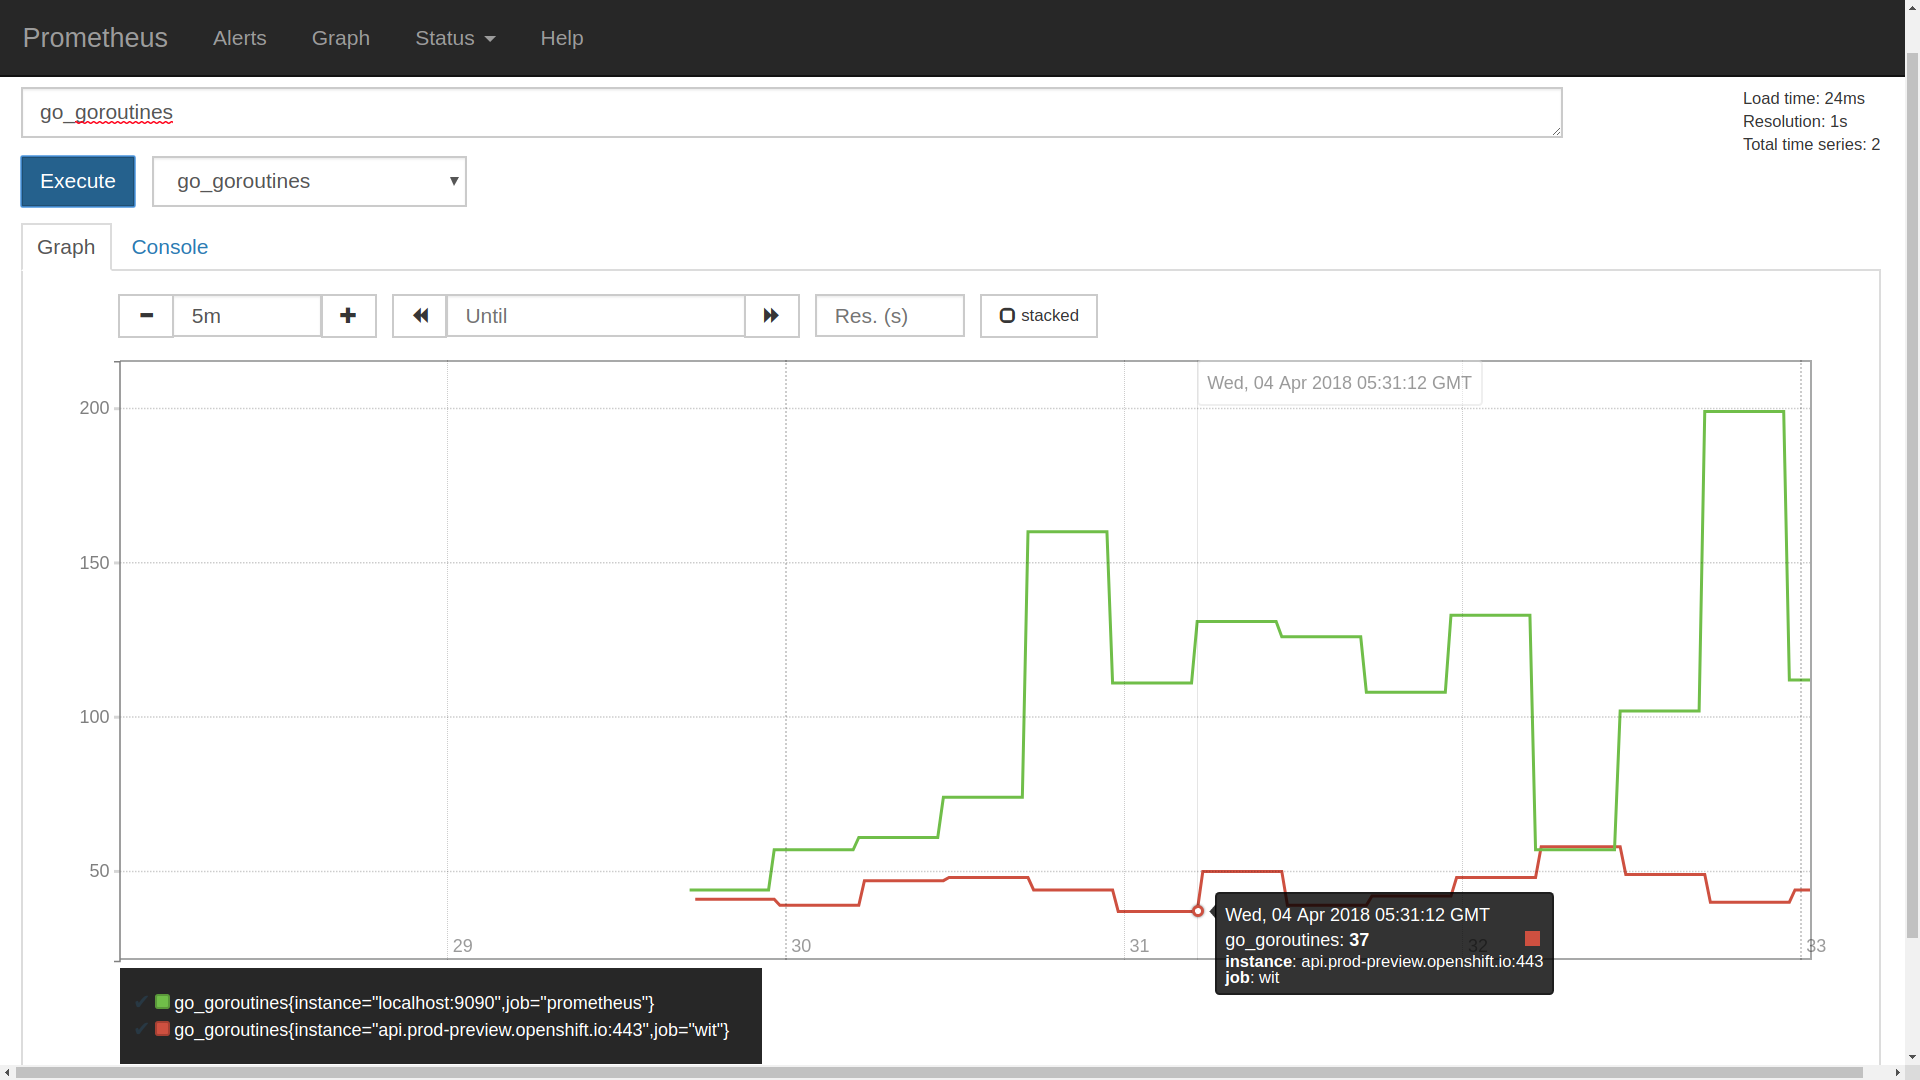
This post is very specific to OpenShift and how you can have an application exposing prometheus metrics to be scraped by a prometheus running in the same cluster.

Requirements
Setting up cluster
I have done it using the oc cluster up, read about how to do this here. You could also setup a local OpenShift cluster by running minishift, read about setting up minishift here.
Downloading Kedge
The configurations defined for setting up this cluster is written in a format that is understood by a tool called Kedge. This makes configuration easier to understand and edit. So for using this setup download Kedge and put it in your path as explained here.

Following the setup
Make sure you have a running OpenShift cluster
oc new-project monitor
Now if your metrics exporting service if it is backed by https then set this flag otherwise the default is http.
export APP_SCHEME=https
Give your application name
export APP_NAME=wit
This one is important, here I have put in the link to the cluster which is exposing metrics, you can put yours.
export APP_URL=api.prod-preview.openshift.io
Download the latest Prometheus Kedge file prometheus.yml. Or you can also download the prometheus.yml which was created as of this writing.
kedge apply -f prometheus.yml
Finally visit this URL to start seeing your prometheus dashboard.
echo http://$(oc get routes | grep prometheus | awk '{print $2}')
How it looks?
$ oc new-project monitor
Already on project "monitor" on server "https://192.168.122.1:8443".

You can add applications to this project with the 'new-app' command. For example, try:

    oc new-app centos/ruby-22-centos7~https://github.com/openshift/ruby-ex.git

to build a new example application in Ruby.

$ export APP_SCHEME=https
$ export APP_NAME=wit
$ export APP_URL=api.prod-preview.openshift.io

$ kedge apply -f prometheus.yml
persistentvolumeclaim "prometheus-storage" created
service "prometheus" created
route "prometheus" created
configmap "prometheus-config" created
deployment "prometheus" created

$ echo http://$(oc get routes | grep prometheus | awk '{print $2}')
http://prometheus-monitor.192.168.122.1.nip.io

Happy monitoring!