How do you monitor your own computer? Of course, using Prometheus, node-exporter and Grafana. You might ask why would you wanna do that when you can simply use the operating system provided, “System Monitor”. Well, yes, you can use that. But the data you get from the OS System Monitor is coarse-grained. OS system monitor is not configurable, but this stack is.

It is like running htop but where you can go back in history, unlike htop, which only shows the current state. Using this stack of Prometheus, node-exporter, and Grafana is a proactive approach than being reactive to the problems that occur on a PC. Instead of digging later to figure out what went wrong, you are already collecting metrics so you can see on dashboards what went wrong.

NOTE: This blog is helpful to you only if you are using a Linux desktop that you would want to monitor. Here docker is used to run tools like node-exporter, and docker does not work natively neither on OSX or Windows. Docker on OSX and Windows runs in a VM, and there is no use in monitoring a VM; the objective of this blog is to monitor your PC.
Prerequisites
- Install Docker.
- Install docker-compose.
Installation
Download the configuration manifests
git clone https://github.com/surajssd/node-monitor
cd node-monitor
Install the configuration
There are two ways to install this stack one as a user systemd, and the other is to dump configs to a directory and manually run docker-compose commands. I would recommend using the user systemd path because it is a cleaner approach. You can interact with the service using systemctl, and journalctl and the services restart automatically once the PC is started.
Execute the following command to install it:
make install-user-systemd
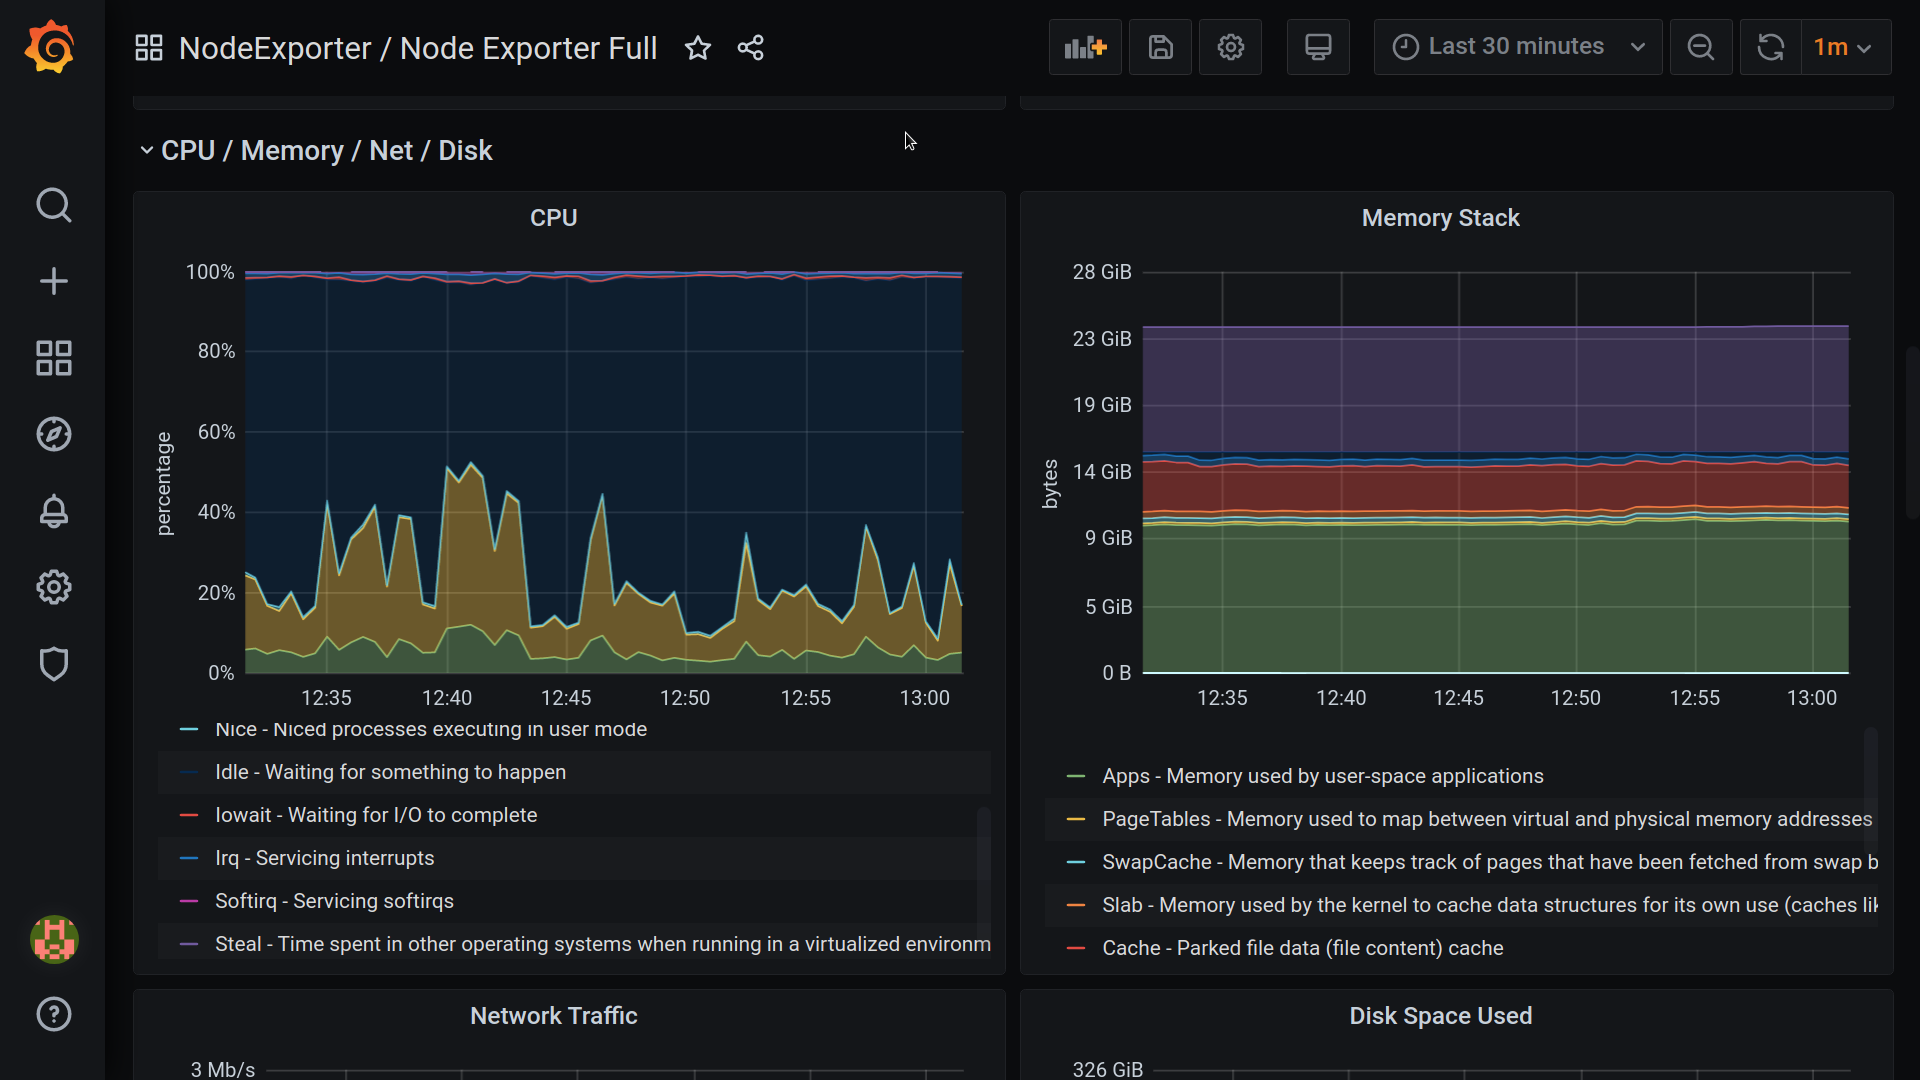
Now go to this URL localhost:3000 to access the Grafana already installed with the Node Exporter dashboard. The login user name and password by default is admin. You can choose to change it at login.
Debug
- To view the logs of the running containers, run the following command:
journalctl --user -u node-monitor
- If containers fail to start, run the following command to delete the stale containers:
docker rm -f $(docker ps -aq)
I hope you find this helpful and learn exciting stuff just watching the dashboard about your system.