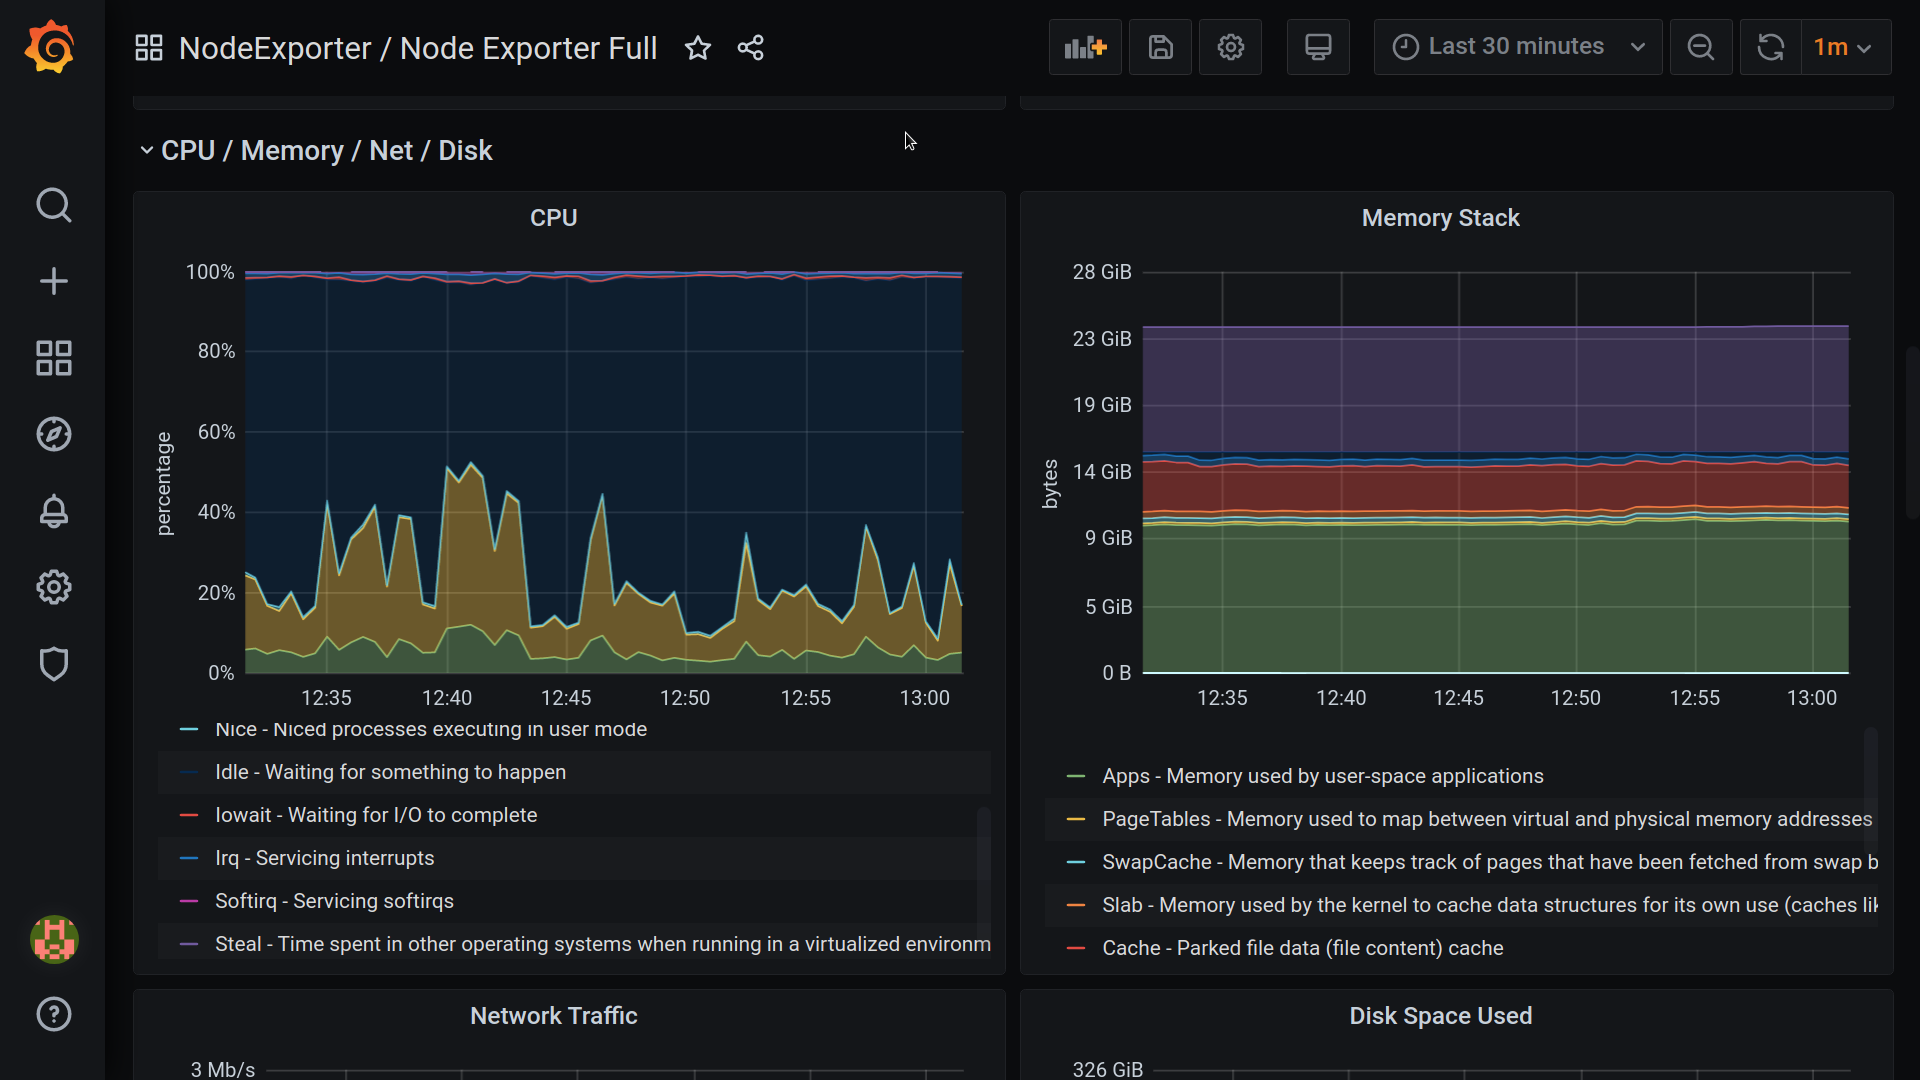
Monitor your PC with Prometheus Grafana stack
How do you monitor your own computer? Of course, using Prometheus, node-exporter and Grafana. You might ask why would you wanna do that when you can simply use the operating system provided, “System Monitor”. Well, yes, you can use that. But the data you get from the OS System Monitor is coarse-grained. OS system monitor is not configurable, but this stack is. It is like running htop but where you can go back in history, unlike htop, which only shows the current state. Using this stack of Prometheus, node-exporter, and Grafana is a proactive approach than being reactive to the problems that occur on a PC. Instead of digging later to figure out what went wrong, you are already collecting metrics so you can see on dashboards what went wrong. ...